| LandingLens | LandingLens on Snowflake |
|---|---|
| # | Item | Description |
|---|---|---|
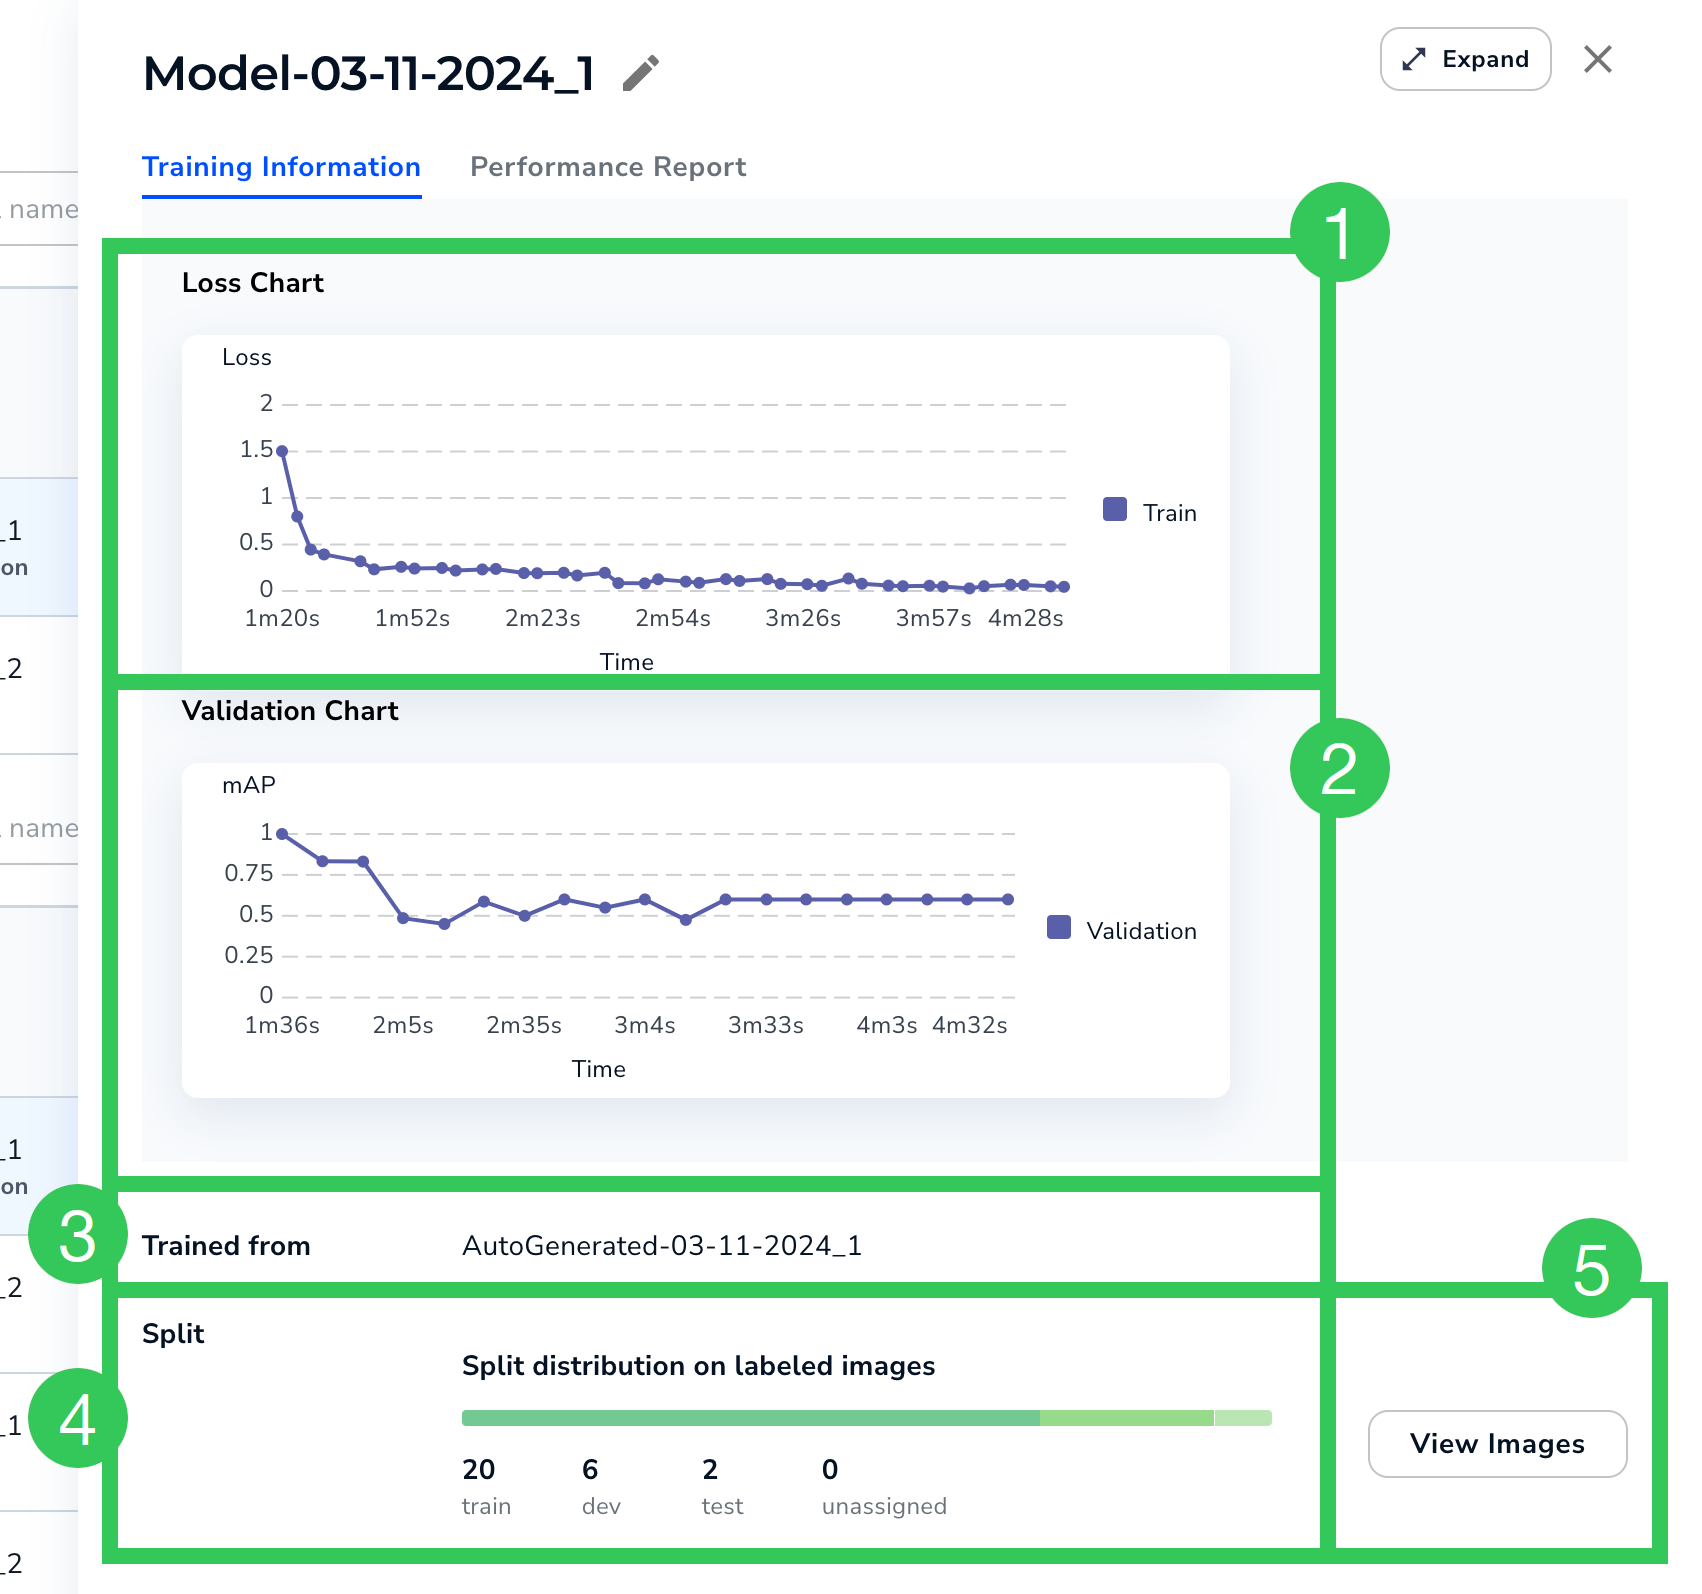
| 1 | Loss Chart | See Loss Chart |
| 2 | Validation Chart | The Validation chart is calculated on the Dev split. This chart displays when the model was trained using Custom Training and the Dev split has at least 6 images. If the model improves during the validation process, the line goes up over time. The line will look slightly different for each project type because each uses a different validation metric:
|
| 3 | Trained From | The name of the dataset snapshot that the model was trained on. |
| 4 | Split | Shows how many images are in each split. |
| 5 | View Images | Click View Images to see the dataset snapshot that the model was trained on. |
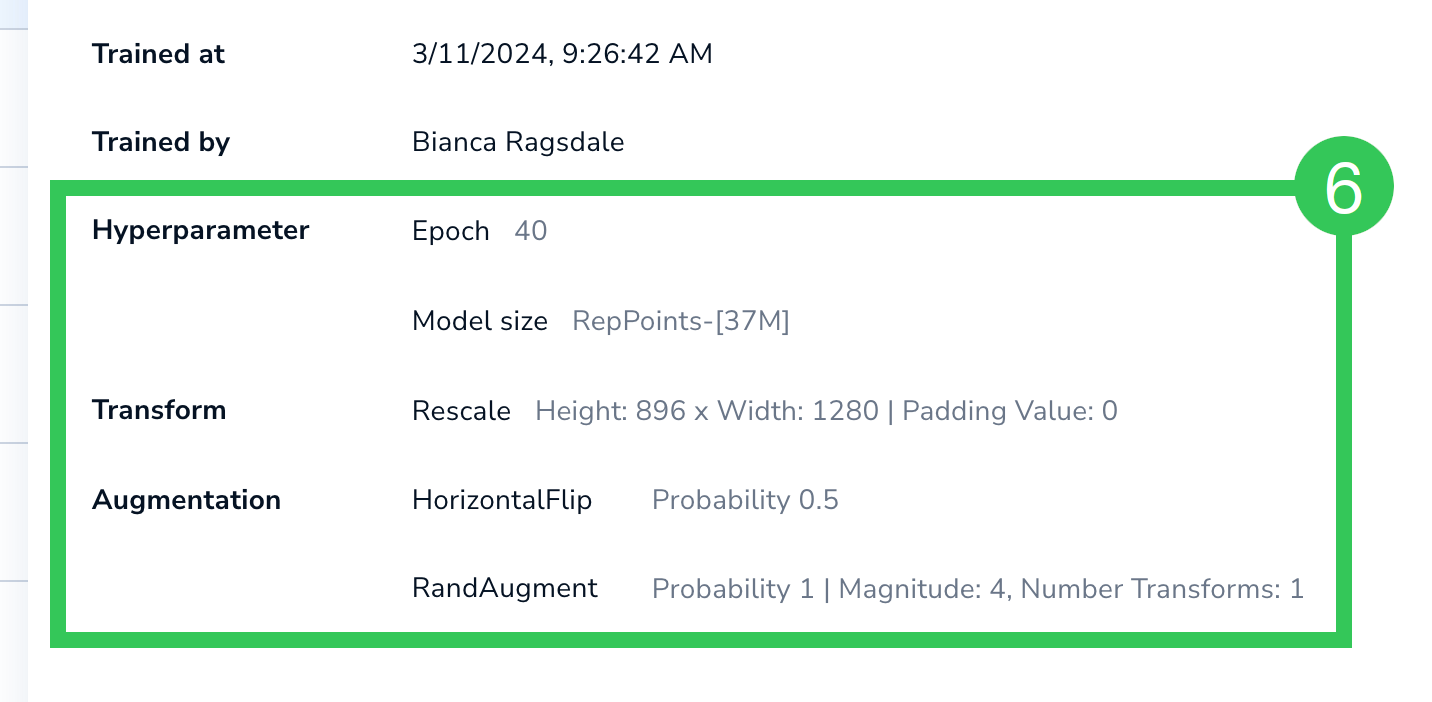
| 6 | Hyperparameter Transform Augmentation | The configurations used to train the model. For Fast Training (default configuration), this includes Hyperparameters, which are the number of epochs and model size. For Custom Training (customized configuration), this also includes any Transforms and Augmentations. For more information about these configurations, go to Custom Training. |