When parsing a document with the library, you can use the visualization utility to create annotated images that show where each chunk of content was extracted from the document.

Visualizing the results is useful for:

  • Verifying the accuracy of the extraction
  • Debugging extraction issues

For example, here is a side-by-side comparision of a document (left) and the saved visualization of that document (right).

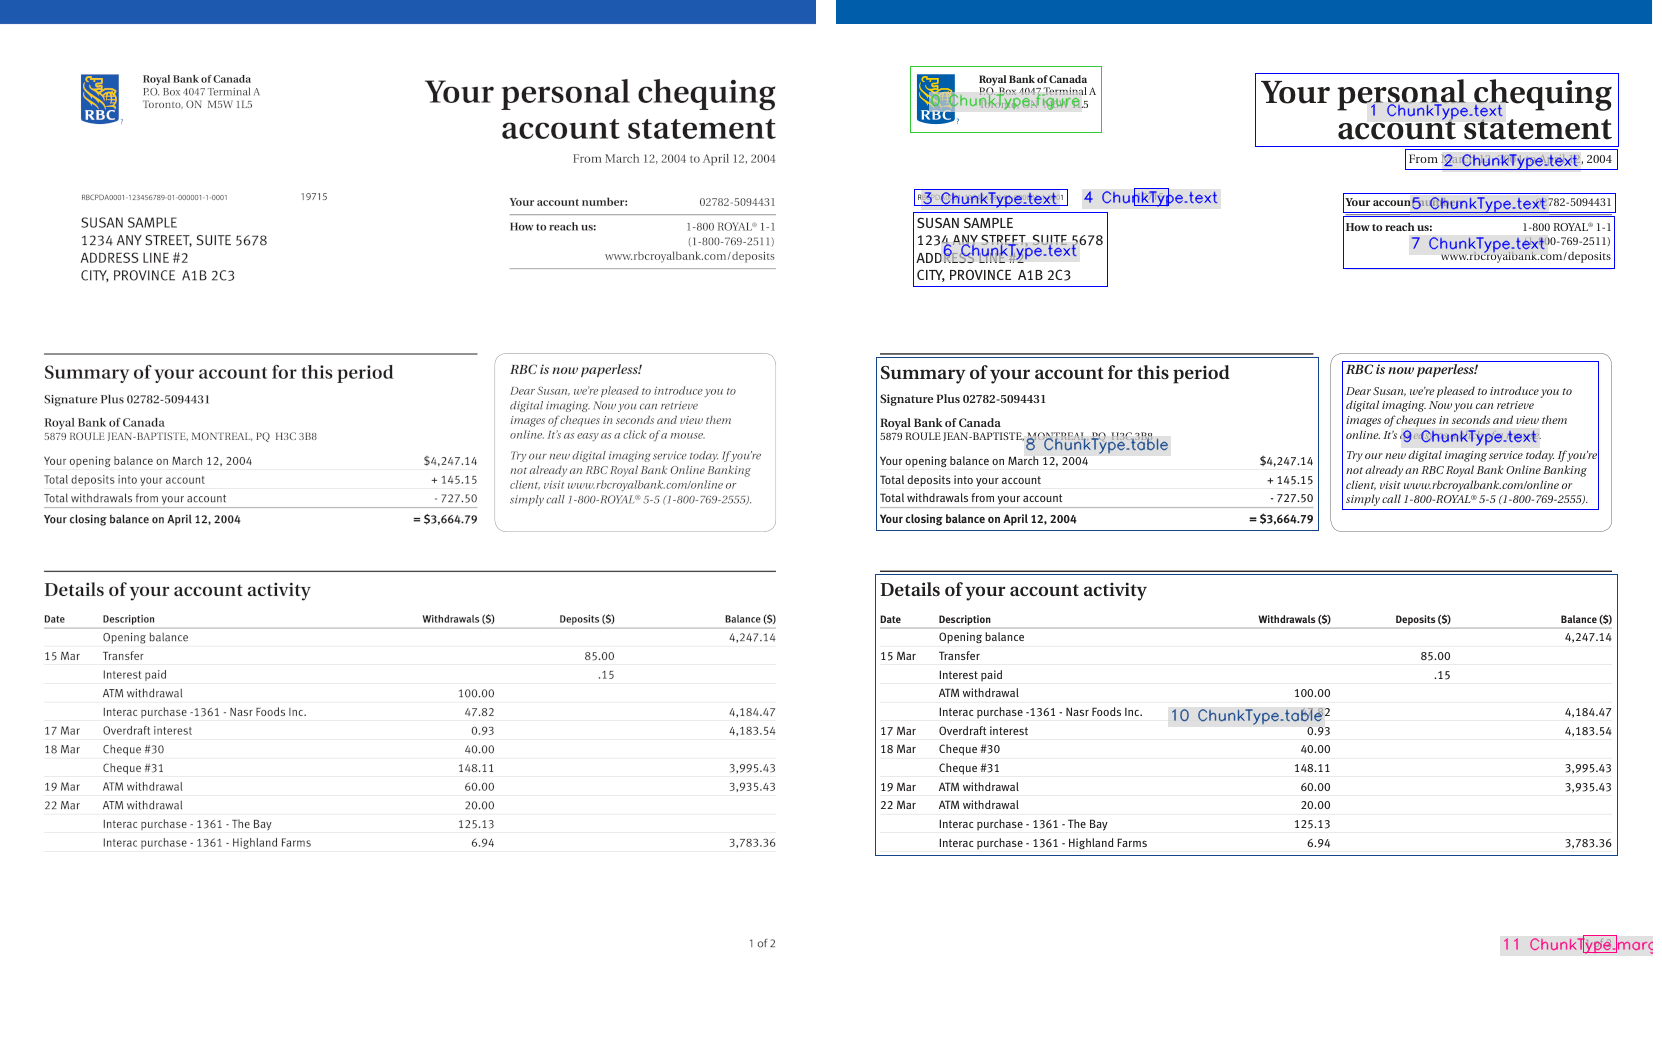
Visualization Features

The visualization shows:

  • Bounding boxes around each extracted chunk
  • Chunk type and index labels
  • Different colors for different types of content (text, tables, etc.)
  • Semi-transparent text backgrounds for better readability

Sample Script: Save Visualization with Default Settings

Run the following script to create visualizations using the default settings from the viz_parsed_document function.

from agentic_doc.parse import parse
from agentic_doc.utils import viz_parsed_document

# Define the document path and output directory
doc_path = "path/to/document.pdf"
output_dir = "path/to/save/visualizations"

# Parse the document (returns a list of parsed documents)
results = parse(doc_path)
parsed_doc = results[0]  # Get the first parsed document

# Create visualizations with default settings
images = viz_parsed_document(
    doc_path,
    parsed_doc,
    output_dir=output_dir
)

Sample Script: Save Visualization with Custom Settings

You can customize the visualization settings by using the VisualizationConfig class. For example, you can change the colors of the bounding boxes around each chunk type.

from agentic_doc.parse import parse
from agentic_doc.utils import viz_parsed_document
from agentic_doc.common import ChunkType
from agentic_doc.config import VisualizationConfig

# Define the document path and output directory
doc_path = "path/to/document.pdf"
output_dir = "path/to/save/visualizations"

# Parse the document (returns a list of parsed documents)
results = parse(doc_path)
parsed_doc = results[0]  # Get the first parsed document

viz_config = VisualizationConfig(
    thickness=2,  # Thicker bounding boxes
    text_bg_opacity=0.8,  # More opaque text background
    font_scale=0.7,  # Larger text
    # Custom colors for different chunk types
    color_map={
        ChunkType.marginalia: (0,255,0),  # Green for marginalia
        ChunkType.table: (0, 0, 255),  # Red for tables
        ChunkType.figure: (255, 165, 0),  # Light blue for figures
        ChunkType.text: (255, 0, 0),  # Blue for regular text
    }
)

images = viz_parsed_document(
    doc_path,
    parsed_doc,
    output_dir=output_dir,
    viz_config=viz_config
)

File Path and File Name Conventions for Saved Visualizations

The visualization files are images that are saved with this structure:

path/to/save/visualizations/
└── document_viz_page_X.png

Where:

  • document is the file name of the document
  • X is the page number